The raw results grid displays the raw data in the query; it's useful if you want to display the raw data without applying any formatting or configuring additional information like color, indicators, size, or tooltips.
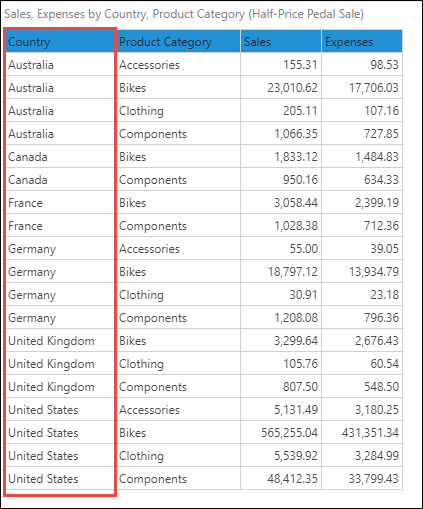
All given hierarchies and measures are displayed as columns in the table. Member elements are not grouped; rather, each row in the hierarchy column contains a member element label. For example, in the image below, each country appears multiple times:
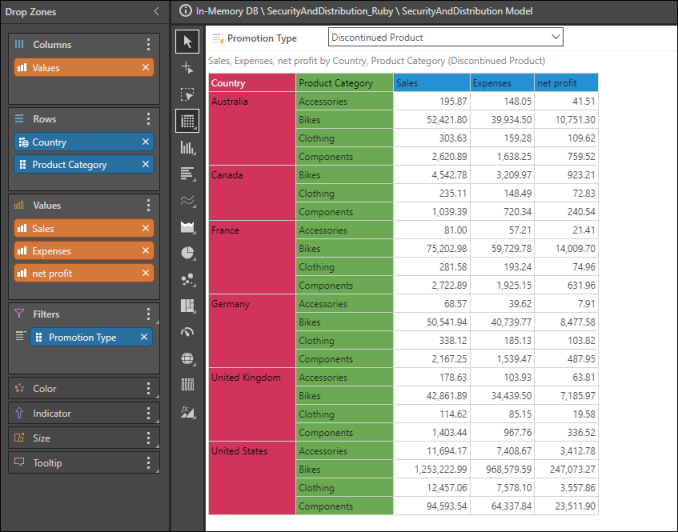
However, matrix grids group the countries:
Note: a query's raw results can be displayed alongside any visual using the Show Data Grid function
Building a Raw Results Grid
Step 1: Select "Raw Results"
To display a raw results grid, right-click the Grid option in the Toolbox and select Raw Results from the sub-menu items:

Step 2: Add columns to your grid
Only two drop zones are enabled when working with raw results grids: Columns and Filters. Add all required hierarchies, member elements, and measures to the columns zone to display them in the grid. The grid columns will be ordered according to the order of chips in the drop zone.

Step 3: Add filters to your grid
To add a filter slicer, add the required hierarchies or measures to the Filters drop zone.
